 Driving Speed vs. Arrival Time: The Hidden Safety, Cost, and Efficiency Reality
Whether managing a fleet of commercial vehicles or driving between site visits, business leaders and safety managers are often asked: Does driving faster actually save meaningful time?
The instinct to travel at or slightly above the speed limit is driven by the perception that higher speeds yield significant time savings. However, when we analyse the physics of driving alongside real-world traffic dynamics and vehicle efficiency data, the math tells a strikingly different story.
We should take time to examine the trade-offs between driving speed, arrival times, braking distances, and vehicle operational costs—and why encouraging a calmer pace on the road is one of the simplest driving safety improvements an organisation can make.
1. The Myth of Speed and Arrival Times
Travel time follows a non-linear formula. Because of this relationship, raising speed at higher baselines yields rapidly diminishing returns in actual time saved.
To see how this works in practice, consider the actual travel times across varying distances at steady speeds from 40 mph to 80 mph:
Travel Time Comparison (Minutes)
| Trip Distance | 40 mph | 50 mph | 60 mph | 70 mph | 80 mph |
| 10 miles | 15.0 mins | 12.0 mins | 10.0 mins | 8.6 mins | 7.5 mins |
| 30 miles | 45.0 mins | 36.0 mins | 30.0 mins | 25.7 mins | 22.5 mins |
| 60 miles | 90.0 mins | 72.0 mins | 60.0 mins | 51.4 mins | 45.0 mins |
Key Takeaways for Drivers
- Diminishing Returns: Increasing speed from 40 to 50 mph over a 30-mile journey saves 9 minutes. However, pushing from 70 to 80 mph over that same distance saves just 3.2 minutes.
- The Real-World Traffic Equalizer: Over a standard 10-mile commute or urban route, accelerating from 60 mph to an illegal 80 mph theoretically saves just 2.5 minutes. In reality, junction queues, traffic signals, and roundabouts eliminate these minor gains almost entirely.
2. The Exponential Safety Cost: Physics & Stopping Distances
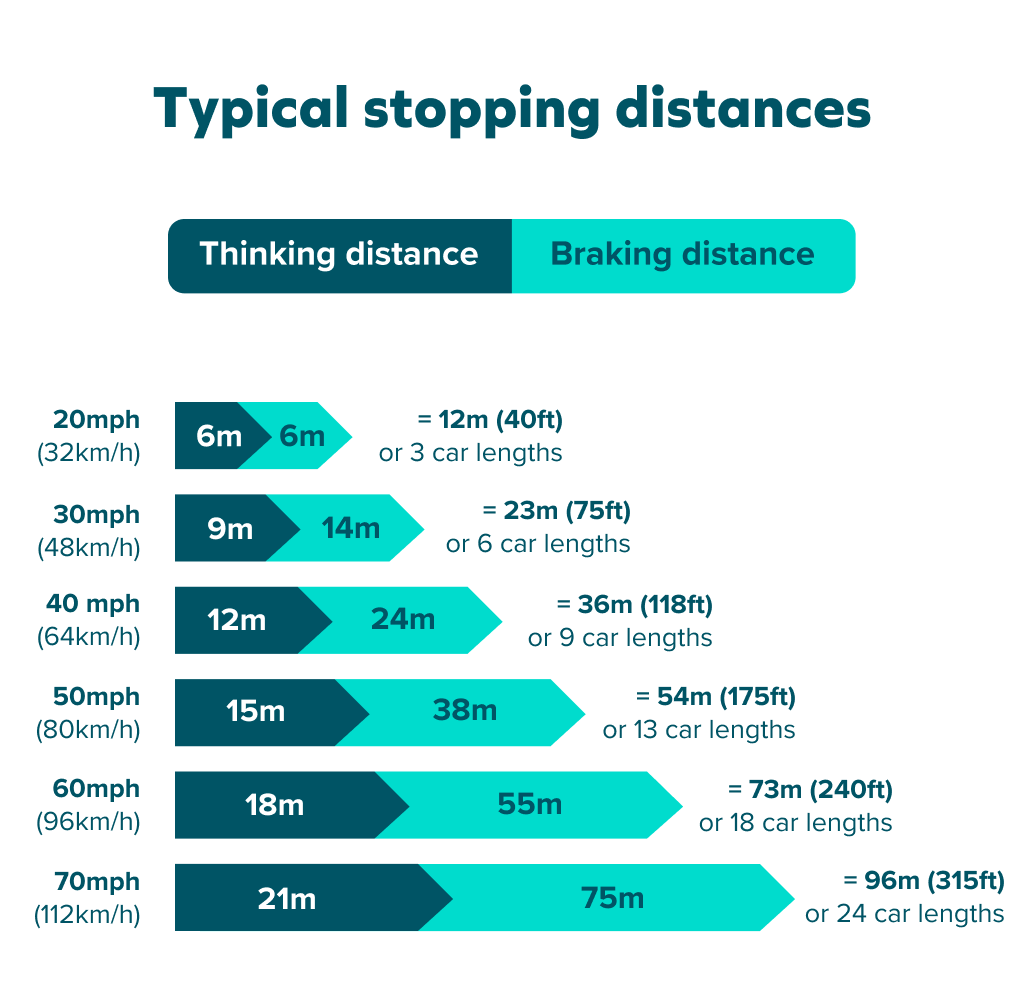
While travel time decreases linearly with speed, kinetic energy increases quadratically. Doubling a vehicle’s speed quadruples the kinetic energy that must be dissipated during braking or absorbed during an impact. Total stopping distance combines thinking distance (reaction time, averaged at 1.5 seconds) and braking distance:
Stopping Distance & Energy Matrix
| Speed | Thinking Distance | Braking Distance | Total Stopping Distance | Kinetic Energy (Ek∝v2) |
| 40 mph | 27 m (88 ft) | 24 m (80 ft) | 51 m (168 ft) | Baseline (1.0x) |
| 50 mph | 34 m (110 ft) | 38 m (124 ft) | 72 m (234 ft) | +56% increase |
| 60 mph | 40 m (132 ft) | 55 m (180 ft) | 95 m (312 ft) | +125% increase |
| 70 mph | 47 m (154 ft) | 75 m (245 ft) | 122 m (399 ft) | +206% increase |
| 80 mph | 54 m (176 ft) | 98 m (321 ft) | 152 m (497 ft) | +300% increase |
Critical Safety Impacts
- Tripled Stopping Distance: Increasing speed from 40 mph to 80 mph increases overall stopping distance from roughly 12 car lengths to over 36 car lengths (152 metres).
- Narrowed Hazard Window: At 70 mph, a driver travels over 30 metres per second before their foot even touches the brake pedal.
- Collision Severity: According to UK road safety research and Health and Safety Executive (HSE) workplace road safety guidance, speed is a primary driver in crash severity. At higher speeds, safety features such as crumple zones and air bags reach physical limits, significantly increasing the probability of serious injury or fatality.
3. Fuel Efficiency, EV Range, and Commercial Costs
Aerodynamic drag escalates with the square of speed, meaning the power required to overcome drag increases with the cube of speed.
| Speed | Aerodynamic Drag (vs 50 mph) | ICE Fuel Economy Impact | EV Battery Range Impact |
| 40 mph | ~36% lower | Optimal urban efficiency | Peak efficiency range |
| 50 mph | Baseline (100%) | Near peak fuel economy (~55–65 mpg) | ~3.8–4.2 miles/kWh |
| 60 mph | +44% higher | ~10–15% drop in mpg | ~3.2–3.5 miles/kWh |
| 70 mph | +96% higher | ~20–25% drop in mpg | ~2.5–2.8 miles/kWh |
| 80 mph | +156% higher | ~35–40% drop in mpg | ~1.9–2.2 miles/kWh |
Commercial Considerations for Fleets
- EV Battery Penalties: For organisations operating electric vehicles, driving at 80 mph instead of 60 mph cuts battery range by up to 35%. The few minutes saved on the motorway are quickly lost waiting at rapid charging points.
- Maintenance and Wear: Higher speeds accelerate tyre degradation and brake pad wear, increasing ongoing fleet maintenance costs.
- Duty of Care: Under UK health and safety law (including the Health and Safety at Work etc. Act 1974), employers have a legal duty to ensure, as far as reasonably practicable, the health and safety of employees driving for work purposes. Promoting defensive, pace-managed driving aligns with risk assessment obligations and reduces insurance liabilities.
Summary: The Smarter Pace
Choosing to drive at 60 mph instead of 80 mph on a 30-mile journey:
- Costs: Adds roughly 7.5 minutes to your travel time;
- Saves: Cuts stopping distance by 57 metres (185 feet), halves vehicle kinetic energy, improves fuel or energy efficiency by up to 30%, and lowers driver stress.
For risk managers, fleet operators, and individual motorists alike, setting realistic journey schedules and adopting a modest speed profile delivers measurable returns in safety, sustainability, and compliance.
Need Guidance on Driving at Work Policies?
From fleet risk assessments to driver safety policy reviews, ensuring your employees remain safe on the roads is a vital part of health and safety management. Contact the team at Outsource Safety to learn more about our competent person schemes and workplace safety support packages.